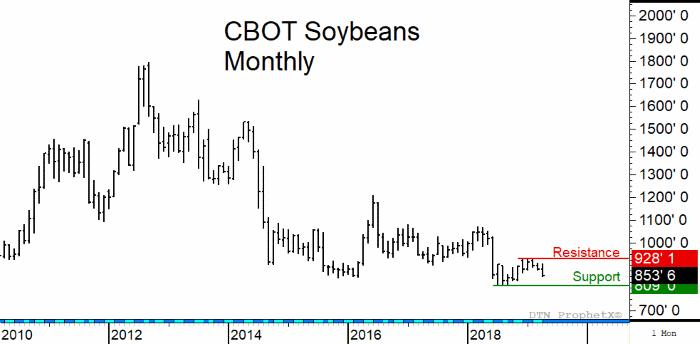
About this chart: This is the monthly CBOT Soybean continuation chart. This shows the high in March 2018 at $10.71. From that high, prices plunged to the July 2018 low at $8.10. Following a 80 cent rally back, soybeans went down to the harvest low and double bottom at $8.12 in September 2018. Futures then rallied $1.20 to the February high at $9.31. The low this week at $8.54 was a 62% retracement of the $1.20 rally.
What this means for you: The timing is right for a secondary low in the soybean market. Initial resistance will be at $8.65, then at $8.80, with major resistance at the February high at $9.31.