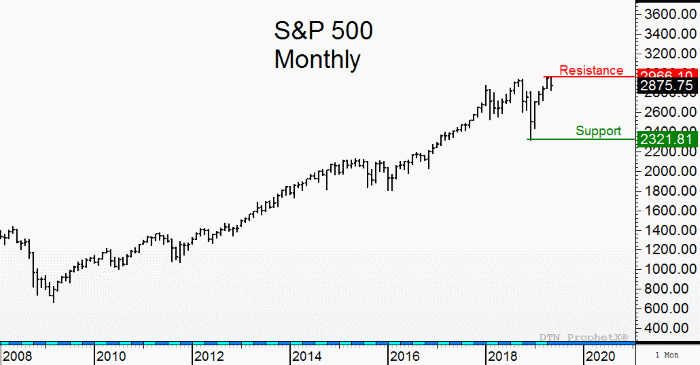
About this chart: This is the weekly S&P 500 Stock index chart. You can see the major low in late 2011 at 1,068. From that low, prices rallied for 7 years to the initial high in September 2018 at 2,944. The stock market dropped about 20% to the December 2018 low. The stock market then rallied to new all-time highs in early May before turning sharply lower over the last two weeks.
What this means for you: The monthly chart shows a potential key reversal lower in the month of May. If the stock market moves lower, then it will initially pull the commodity markets lower as well. Many long-term investors are starting to move out of the stock market into commodity-related investments to diversify their portfolios.