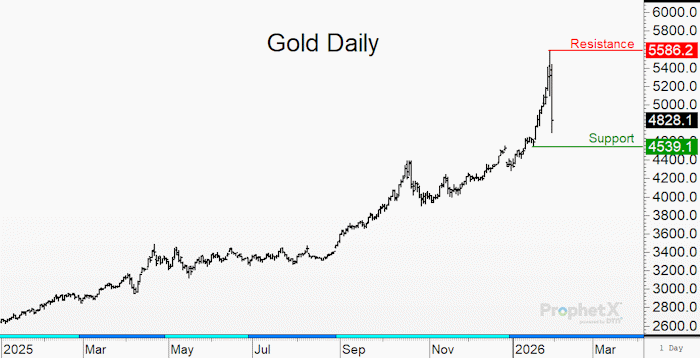
About this chart: This is the daily continuation chart of gold futures. You can see the bullish trend (which started in January 2025) may have just reached a major high this week at $5,586. The extreme volatility that was seen on Thursday and Friday amounted to a range of $886 or nearly a 16%. This may be a once-in-a-lifetime move we just witnessed.
What does this mean for you: The extreme volatility in the gold and silver futures likely had some negative impact across the grain sector late this week. If gold prices can stabilize in the near term, then it would ease the pressure traders are feeling from the outside markets.