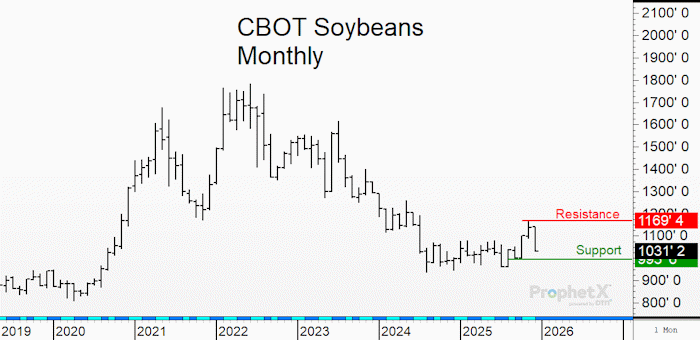
About this chart: This is the monthly continuation chart of CBOT soybean futures. You can see the major high ($17.80) in June 2022, and the trend lower to the major low ($9.36) in August 2024. The market stayed in a $1.50 trading range for the next year. In October, prices rallied above $10.70 resistance with a high posted at $11.69 in early November 2025. Prices were hit hard in November. Now long-term support is at the $10.00 benchmark.
What does this mean for you: Watch for a close above the two previous weeks’ high to signal a short-term and potential long-term low on the soybean chart.